What's New on STW
We add new printable worksheets, games, and teaching tools all the time! This page highlights some of our most recent additions to the site.
2,554 new files added over the past 365 days.

(added June 12, 2025)
Determine whether the type of data described is qualitative or quantitative. This worksheet includes definitions for qualitative and quantitative data that students can refer to to help them complete the activity.
Filing Cabinet
Logged in members can use the Super Teacher Worksheets filing cabinet to save their favorite worksheets.
Quickly access your most used files AND your custom generated worksheets!
Please login to your account or become a member and join our community today to utilize this helpful feature.
(added June 12, 2025)
Determine how many fractional unit cubes fit inside each rectangular prism. Then find the volume of the prism.
(added June 12, 2025)
These vocab cards include important statistics and data analysis terms such as absolute deviation, cluster, distribution, gap, interquartile range, outlier, and many more. Definitions and examples are given for different types of data charts, plots, and graphs as well.
(added June 12, 2025)
This reference sheet gives definitions and examples of vocabulary words and terms related to analyzing and describing data sets, visual displays of data sets, and general data terms.
(added June 12, 2025)
Fill in the blanks with the correct statistics and data vocabulary words to complete the sentences.
(added June 12, 2025)
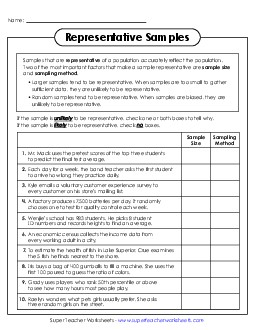
Read examples of samples and decide whether they're likely to be representative or not. If they're not, decide whether the issue is with sample size, sampling method, or both.
(added June 12, 2025)
Each question on this worksheet describes a situation and then asks the students choose either the sample or population that is described. The page includes a description and example students can refer to if they need a reminder of the difference between populations and samples.
(added June 12, 2025)
Reinforce students' understanding of population and sample with this worksheet. Students will read about a situation and identify both the population and the sample described.
(added June 12, 2025)
Read each situation and identify the population. This worksheet helps students learn to distinguish between population and sample.
(added June 12, 2025)
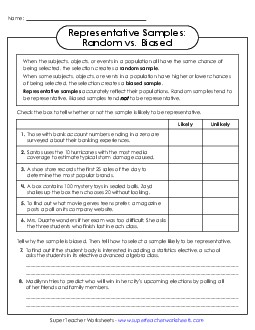
Determine whether samples described are likely to be representative of their populations or not. This worksheet includes a description of random and biased samples.

Have you seen the Super Teacher Blog? We post fun, new teaching ideas every month.
Be sure to check it out. Go To STW's Blog
(added June 12, 2025)
With this worksheet, students will practice identifying whether a sample is random or biased. The top of the worksheet offers a brief explanation students can reference to help them complete the assignment.
(added June 12, 2025)
Use the given line plots and histograms to describe the data shown.
(added June 12, 2025)
With this worksheet, students will use sets of data to find the range, interquartile range (IQR), and mean absolute deviation (MAD). They will also determine which measures best describe certain data.
(added June 12, 2025)
On the first page of this worksheet, students will choose which kind of data display makes most sense for each situation. On the second page, they will choose which measure of center or variability makes sense.
(added June 12, 2025)
This worksheet shows 8 types of data displays. Students will identify each one by writing the correct term from the word bank. This worksheet includes a bar graph, frequency table, box plot, histogram, circle graph, line graph, dot plot, and stem-and-leaf plot.
(added June 12, 2025)
Keep track of how many words per minute your students can correctly read with this handy graph. Color it in like a bar graph, or write the exact number of words to keep even closer track.
(added June 12, 2025)
This reading fluency graph helps you keep track of your students' progress, with space to keep track of data from up to 10 dates. There are spaces to mark the number of words correct per minute up to 100.
(added June 12, 2025)
This reading fluency chart helps you keep track of more advanced readers' progress, with space for up to 200 words correct per minute.
(added June 11, 2025)
Students will use these task cards to practice ordering rational numbers, including positive and negative numbers, whole numbers, fractions, and decimals. They will also practice comparing them with greater than and less than symbols.
(added June 11, 2025)
The city can be loud! This passage is all about what you can hear in the city, and is specifically written for early readers.
(added June 11, 2025)
Read about a boy's busy week with this short passage and reading comprehension worksheet. Students will answer questions about the basic text and practice tracing and writing words. There is also a drawing page.
(added June 11, 2025)
This anchor chart introduces students to the three most common measures of center: mean, median, and mode. It provides an example and describes the limitations of each measure.
¿Habla español?
Many of our worksheets have been translated into Spanish! Click the button below worksheet descriptions to view our Spanish translations. Learn more.
Many of our worksheets have been translated into Spanish! Click the
 button below worksheet descriptions to view our Spanish translations. Learn more.
(added June 11, 2025)
This anchor chart lays out a detailed overview of what mean, median, mode, and range are, as well as steps to find these values.
(added June 10, 2025)
Wrap up your book unit on Wonder with this set of questions for Part Eight: August. Students will write careful reflections and answer several multiple choice questions about what they've read.
(added June 10, 2025)
This crossword is an engaging way for students to practice the vocabulary words from part 8 of the book Wonder.
(added June 10, 2025)
Spritzed, rappelled, courteous, perched, monumental, and revelation are some of the words included on our vocabulary cards for part 8 of the book Wonder by R. J. Palacio.
(added June 10, 2025)
Review the vocabulary for part 8 of the book with a matching activity, complete the sentence page, and a section to write and draw definitions.
(added June 10, 2025)
Finish the school year strong with the last set of our 6th grade daily Fix the Sentences worksheets.
(added June 6, 2025)
Statistical questions can generate quantitative or numeric data as well as qualitative or categorical data. On this printable statistics worksheet, students must write a question of each type for every listed topic.
(added June 6, 2025)
Flex your statistics skills with this real-world context worksheet! Each question presents a problem or situation, such as not wanting to overpay for services. Students must write a statistical question to generate quantitative data useful to the situation.
(added June 6, 2025)
On this free statistics worksheets, choose which of two questions is statistical when asked of multiple people. Then write a statistical question about each of five given topics for a survey.
(added June 6, 2025)
Use this fun statistics activity to help kids master statistical questions. Cut out the 20 examples -- such as What is Katrina's favorite school subject? and What grade did students get on the science test? -- then glue them on the correct side of the T-chart.
(added June 6, 2025)
Non-statistical questions have only one answer while statistical questions need or can have many different answers. Using two models, students will identify which kind each of 15 questions is.
(added June 6, 2025)
For this week's ELA practice, use quotation and question marks in speech, use suffixes to create adverbs, correct common misspellings like s vs. soft c and 'i before e,' identify singular and plural pronouns, and plenty more!
(added June 6, 2025)
Practice using phrases rooted in mythology like "Pandora's box," correctly punctuate dialogue, spell absorbed prefixes, choose between words with similar meanings, and more in this set of five English skills worksheets.
(added June 5, 2025)
Maintaining ELA skills is easy with these daily proofreading worksheets.
(added June 5, 2025)
Challenge your students to find the errors in these sentences and rewrite them correctly.
(added June 5, 2025)
Make sure your students maintain their spelling, grammar, punctuation, and all-around writing skills with this week's set of Fix the Sentences worksheets.
(added May 30, 2025)
Find the unit rate then apply it to find an unknown quantity using ratio reasoning. Several questions use decimal quantities or unit rates and one requires conversion of hours to minutes.
(added May 30, 2025)
This worksheet has 6 basic, two-step word problems. Find the unit rate for each scenario, then apply it to find a proportional rate. Only one unit price situation uses decimals.
(added May 30, 2025)
Find two unit rates for each scenario and identify which is greater in context. Requires comparing decimals.
(added May 30, 2025)
Calculate the unit rate for each rate using ratio language. Then practice expressing unit rates as equations. One question uses a decimal or fraction unit rate. Questions specify which variable is expressed in terms of the other.
(added May 30, 2025)
Word problems state a rate and give variables for both quantities. Tell which of four unit rate equations correctly expresses the situation. Includes some fraction and decimals.
(added May 30, 2025)
Each word problem expresses either a rate or unit rate ratio relationship between two quantities. Set up an equation then find the missing value.
(added May 30, 2025)
Pair fifteen rate ratios with their unit rate ratios. All situations include at least one fraction or decimal unit rate.
(added May 30, 2025)
In this letter-matching unit rate activity, students are given rates expressed in ratio language. Find the corresponding unit rate and write its letter on the line.
(added May 30, 2025)
Understand rates and unit rates as expressions of ratio relationships using a model, then find both for 10 situations. Quantities and unit rates include decimals.
(added May 30, 2025)
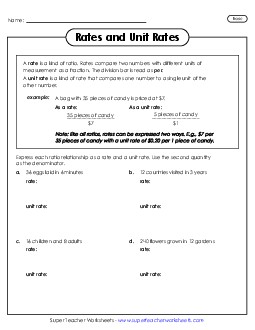
Express each ratio relationship as a rate and a unit rate. Comes with an explanation of rates as ratios. Quantities are only whole numbers.
(added May 27, 2025)
Practice using scale ratios in context with these word problems. For some, use a given scale to find missing measurements. For the rest, use given measurements to determine the scale relationship.
(added May 27, 2025)
Identify the scale and scale factor for different pairs of similar shapes. Then use the scale factor to find the missing dimension.


